Graduation rates of the first-time entering, full-time cohort are analyzed by the institution to track the percentage of students who successfully graduate from the institution within 150% of normal time to a degree. This metric is published in the Online Factbook in accordance with SACSCOC Standard 8.1.
Definition
Calculates the percentage of students in the first-time entering full-time cohort that graduate within 150% of normal time to a degree.
Expected Outcome
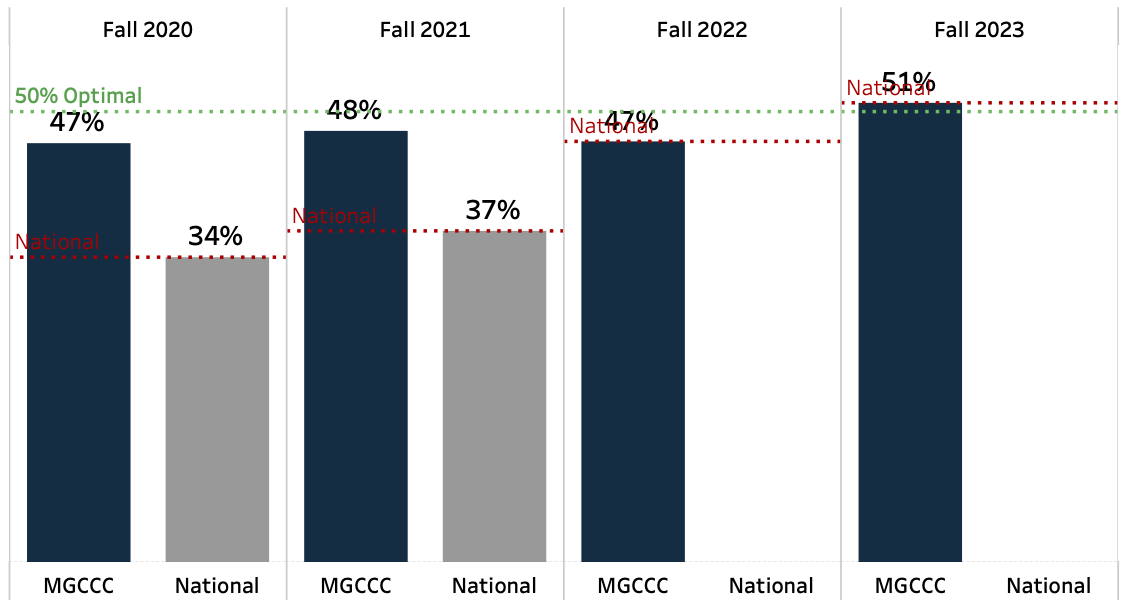
Optimally, 50% of the first-time entering, full-time cohort will graduate from the institution within 150% of normal time to a degree (target). The minimum threshold for the 150% graduation rate is the national average of the 150% graduation rates for the first-time entering, full-time cohort at two-year public community colleges as reported by IPEDS.
College Aggregate Results
Year
MGCCC
National
Fall 2020
47%
34%
Fall 2021
48%
37%
Fall 2022
47%
N/A
Fall 2023
51%
N/A
Optimal
50%
50%
1-Full-Time
Unduplicated Headcount
Distinct Graduates
Graduation Rates at 150%
Fall 2020
1,535
715
47%
Fall 2021
1,506
721
48%
Fall 2022
1,653
772
47%
Fall 2023
1,683
858
51%
Results by Demographic Variables
Variable/Year
Fall 2020
Fall 2021
Fall 2022
Fall 2023
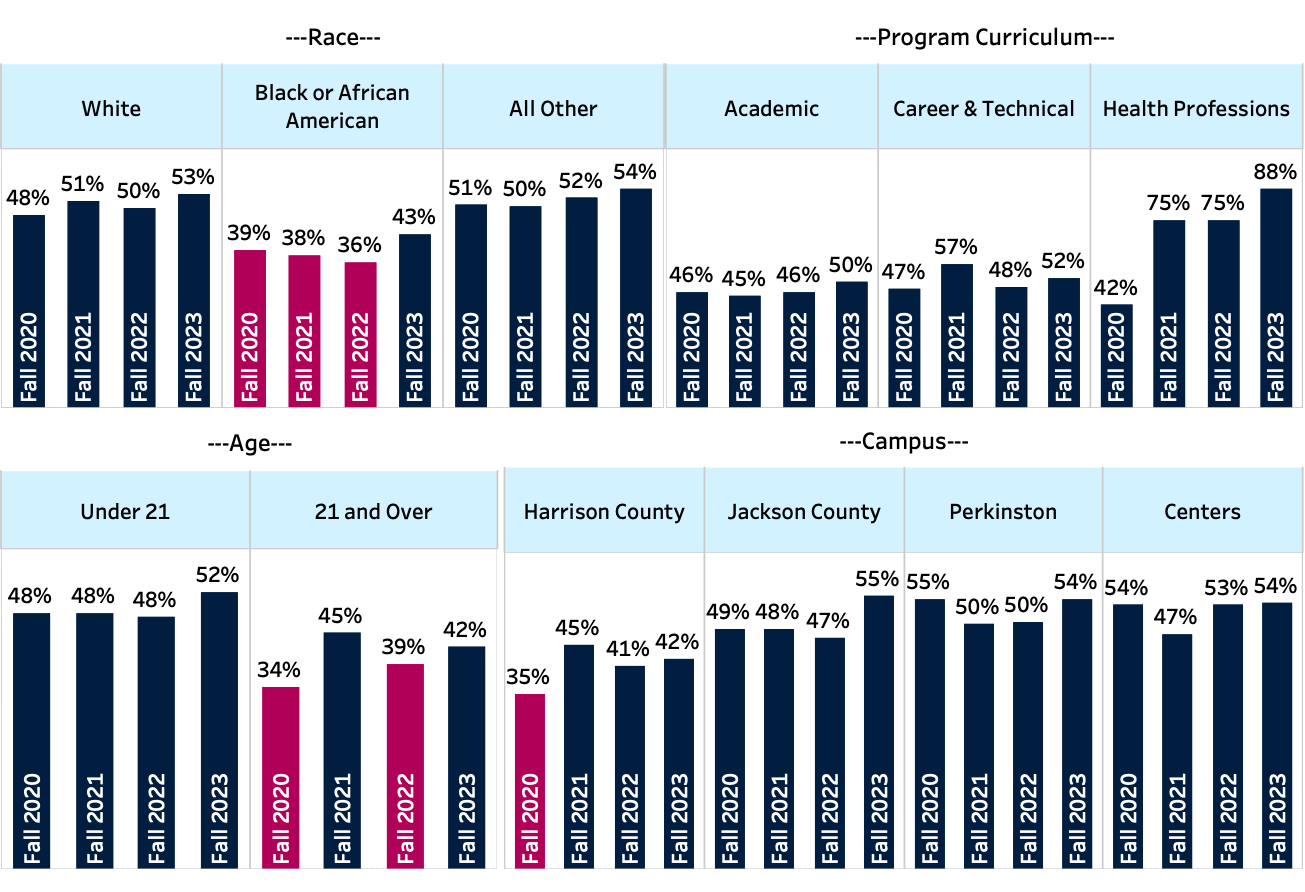
Race: White
48%
51%
50%
53%
Race: Black or African American
39%
38%
36%
43%
Race: All Other
51%
50%
52%
54%
Program Curriculum: Academic
46%
45%
46%
50%
Program Curriculum: Career and Technical Education