Graduation Rates
Area of Focus: Student Achievement – Progression
About: MGCCC meets community needs by providing students with marketable skills and credentials obtained at program completion in a reasonable amount of time. Graduation rates of the first-time first year cohort are analyzed to better understand the percentage of incoming full-time, first-time entering students who graduate at the institution within three years’ time (150%). The rate is calculated as the total number of completers within 150% of normal time divided by the number of students in the full-time, first-time entering (FTFY) cohort.
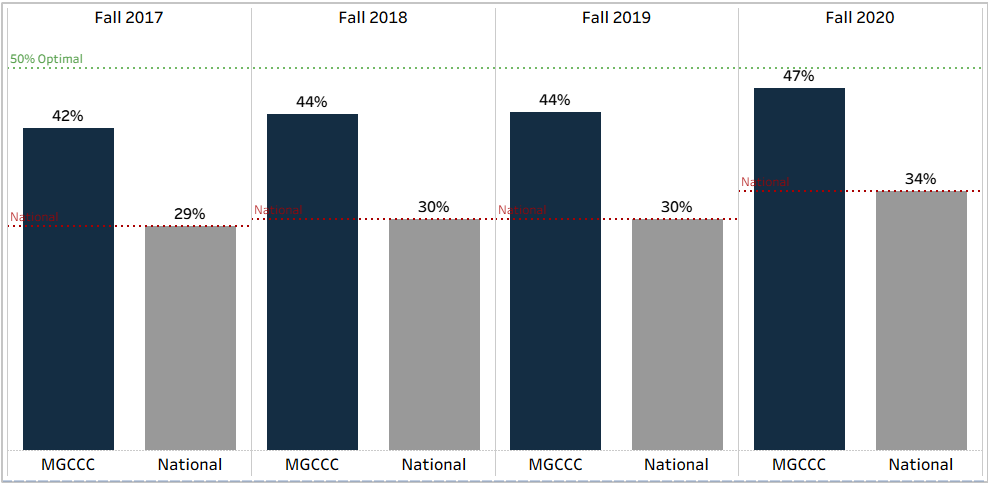
Target Outcome: At a minimum, the college aims to meet or exceed the national average graduation rate as reporting to IPEDS by public two-year community colleges. The college set a goal to exceed the national benchmark and graduate 50% of the first time entering, full-time cohort will graduate from the institution within 150% of normal time to a degree (target). (Data Source: IPEDS)
First Time Entering, Full-Time Graduation Rates at 150%:

| Fall 2017 | Fall 2018 | Fall 2019 | Fall 2020 | |
|---|---|---|---|---|
| MGCCC (IPEDS) | 42 | 44 | 44 | 47 |
| National Two Year Public Institutions (IPEDS) | 29 | 30 | 30 | 34 |
Gender: First Time Entering, Full-Time Graduation Rates at 150%
| Fall 2017 | Fall 2018 | Fall 2019 | Fall 2020 | ||
|---|---|---|---|---|---|
| Female | Graduation Rates | 43% | 44% | 46% | 49% |
| Graduates in Cohort | 425 | 454 | 487 | 433 | |
| FTFY Cohort | 981 | 1,042 | 1,068 | 878 | |
| Male | Graduation Rates | 41% | 45% | 43% | 46% |
| Graduates in Cohort | 324 | 387 | 366 | 321 | |
| FTFY Cohort | 796 | 862 | 857 | 700 |
Race: First Time Entering, Full-Time Graduation Rates at 150%
| Fall 2017 | Fall 2018 | Fall 2019 | Fall 2020 | ||
|---|---|---|---|---|---|
| American Indian or Alaska Native | Graduation Rates at 150% | 14% | 33% | 50% | 56% |
| Graduates in Cohort | 1 | 3 | 3 | 5 | |
| FTFY Cohort | 7 | 9 | 6 | 9 | |
| Asian | Graduation Rates at 150% | 56% | 56% | 62% | 64% |
| Graduates in Cohort | 27 | 33 | 31 | 21 | |
| FTFY Cohort | 48 | 59 | 50 | 33 | |
| Black or African American | Graduation Rates at 150% | 30% | 37% | 40% | 40% |
| Graduates in Cohort | 144 | 162 | 198 | 138 | |
| FTFY Cohort | 475 | 434 | 493 | 346 | |
| Hispanic/Latino | Graduation Rates at 150% | 46% | 43% | 36% | 45% |
| Graduates in Cohort | 51 | 61 | 46 | 39 | |
| FTFY Cohort | 112 | 143 | 127 | 87 | |
| Native Hawaiian or Other Pacific Islander | Graduation Rates at 150% | 33% | 100% | 100% | 0% |
| Graduates in Cohort | 1 | 1 | 1 | 0 | |
| FTFY Cohort | 3 | 1 | 1 | 3 | |
| White | Graduation Rates at 150% | 47% | 47% | 47% | 49% |
| Graduates in Cohort | 481 | 525 | 497 | 414 | |
| FTFY Cohort | 1,024 | 1,128 | 1,056 | 844 | |
| Two or more races | Graduation Rates at 150% | 44% | 42% | 43% | 48% |
| Graduates in Cohort | 40 | 48 | 43 | 29 | |
| FTFY Cohort | 90 | 114 | 101 | 60 | |
| Race and Ethnicity Unknown | Graduation Rates at 150% | 21% | 38% | 37% | 51% |
| Graduates in Cohort | 4 | 8 | 35 | 125 | |
| FTFY Cohort | 19 | 21 | 94 | 246 |
Pell Status: First Time Entering, Full-Time Graduation Rates at 150%
| Fall 2017 | Fall 2018 | Fall 2019 | Fall 2020 | ||
|---|---|---|---|---|---|
| Awarded Pell | Graduation Rates | 37% | 40% | 42% | 44% |
| Graduates in Cohort | 415 | 453 | 513 | 397 | |
| FTFY Cohort | 1,127 | 1,146 | 1,224 | 909 | |
| Not Awarded Pell | Graduation Rates | 51% | 51% | 49% | 53% |
| Graduates in Cohort | 334 | 388 | 340 | 357 | |
| FTFY Cohort | 650 | 758 | 701 | 669 |
